


The segregation phenomenon in the production process of zinc alloy ingots is caused by the different densities and solidification sequences of metal elements in the alloy and the different distribution of each element in the alloy ingot during solidification. This normal physical phenomenon does not affect the production of die casting, because after the alloy ingot is melted into a liquid state, the elements are evenly distributed. However, taking too few samples or improperly area them can skew the test results compared to laboratory tests. Therefore, when we test the composition of alloys, the correct sampling method becomes important. As a result, there is a set of standard sampling methods for zinc alloy ingots in the world, such as the British EN12060. Below, we compare the effects of different sampling methods on the test results, with the test results taken by the standard method as the criterion.
Method 1:
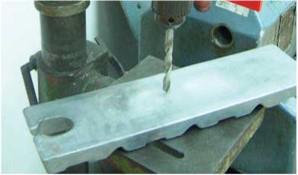
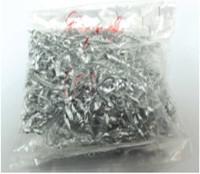
According to the standard sampling method, 12 ingots were randomly selected from the same batch of alloy ingots, and holes were drilled at different positions on the ingots, and drill cuttings were collected as samples for testing. In order to avoid the segregation of alloy ingots affecting the test results, the results obtained from standard sampling methods are used as the basis for the determination. According to the results obtained from the standard sampling method, the composition of the alloy is in accordance with the international standard ASTM B240-13.
Result % | ||||||||
Al | Mg | Pb | Fe | Cd | Cu | Sn | Zn | |
Sample | 4.0 | 0.04 | <0.0005 | 0.0026 | 0.0029 | <0.0005 | <0.0005 | Remaining |
ASTM B240-13 Standard | 3.9-4.3 | 0.03-0.06 | 0.10 max | 0.035 max | 0.0040 max | 0.0030 max | 0.0015 max | Remaining |
Method 2:
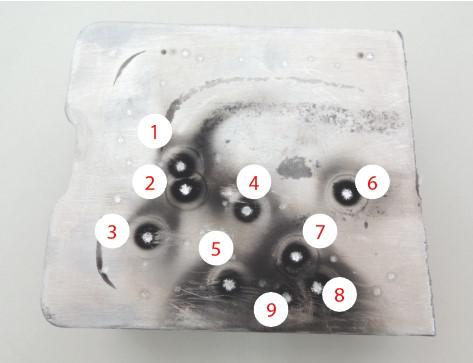
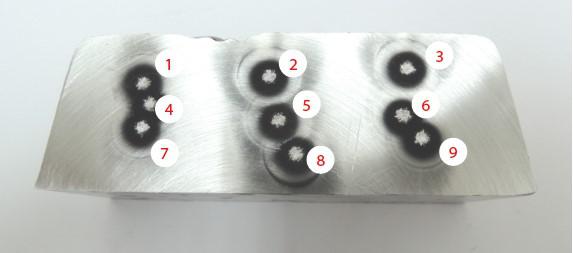
Directly perform analysis using a direct-reading spectrometer on the polished bottom surface of the alloy ingot. The results obtained by this method are very volatile, with aluminium as an example, ranging from 4.1% to 4.9% and higher than those obtained using the standard method. This is precisely due to segregation. In general, zinc ingots contain more aluminium close to the surface than inside, so the composition obtained by this sampling method is not representative of the overall composition of the ingot.
Testing Position | Result % | |||||||
Al | Mg | Pb | Fe | Cd | Cu | Sn | Zn | |
1 | 4.9 | 0.052 | 0.0028 | 0.002 | 0.0006 | <0.0005 | <0.0005 | Remaining |
2 | 4.5 | 0.055 | 0.0027 | 0.002 | 0.0007 | <0.0005 | <0.0005 | Remaining |
3 | 4.4 | 0.052 | 0.0022 | 0.002 | 0.0006 | <0.0005 | <0.0005 | Remaining |
4 | 4.3 | 0.034 | 0.0014 | 0.003 | 0.0005 | <0.0005 | <0.0005 | Remaining |
5 | 4.6 | 0.051 | 0.0026 | 0.002 | 0.0007 | <0.0005 | <0.0005 | Remaining |
6 | 4.4 | 0.035 | 0.0017 | 0.000 | 0.0007 | <0.0005 | <0.0005 | Remaining |
7 | 4.4 | 0.034 | 0.0014 | 0.003 | 0.0006 | <0.0005 | <0.0005 | Remaining |
8 | 4.4 | 0.055 | 0.0022 | 0.003 | 0.0007 | <0.0005 | <0.0005 | Remaining |
9 | 4.3 | 0.032 | 0.0016 | 0.002 | 0.0005 | <0.0005 | <0.0005 | Remaining |
Method 3:
Directly analysis on the cross-section of the alloy ingot using direct-reading spectrometer, with the cross-section is polished before the test. This method also does not avoid the deviation caused by segregation, and the test results are also relatively fluctuating (3.7% to 4.1%), and the deviation between individual parts and actual components is large. As a whole, the aluminium content of the ingots near the upper and lower sides is higher than in the middle area, so this method is not suitable.
Testing Position | Result % | |||||||
Al | Mg | Pb | Fe | Cd | Cu | Sn | Zn | |
1 | 4.0 | 0.046 | 0.0028 | 0.003 | 0.0006 | <0.0005 | <0.0005 | Remaining |
2 | 4.0 | 0.038 | 0.0023 | 0.003 | 0.0005 | <0.0005 | <0.0005 | Remaining |
3 | 4.0 | 0.043 | 0.0024 | 0.004 | 0.0006 | <0.0005 | <0.0005 | Remaining |
4 | 3.9 | 0.039 | 0.0020 | 0.003 | 0.0006 | <0.0005 | <0.0005 | Remaining |
5 | 3.8 | 0.037 | 0.0022 | 0.005 | 0.0005 | <0.0005 | <0.0005 | Remaining |
6 | 3.7 | 0.037 | 0.0022 | 0.004 | 0.0005 | <0.0005 | <0.0005 | Remaining |
7 | 4.1 | 0.046 | 0.0026 | 0.003 | 0.0006 | <0.0005 | <0.0005 | Remaining |
8 | 3.8 | 0.044 | 0.0027 | 0.003 | 0.0006 | <0.0005 | <0.0005 | Remaining |
9 | 4.1 | 0.038 | 0.0020 | 0.003 | 0.0005 | <0.0005 | <0.0005 | Remaining |
Method 4:
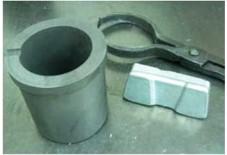
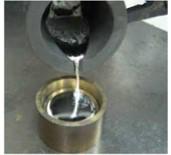
Cut a piece from the alloy ingot, remelt it, and make a sample dish, then flatten one of the planes, and use a direct reading spectrometer to test on this plane. The advantage of this method is that the effects of segregation can be minimized after remelting. From the test results, taking the aluminium content as an example, although it is 0.1% different from the results made by the standard method, the composition of each point is relatively consistent.
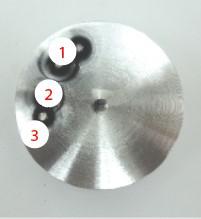
Testing Position | Result % | |||||||
Al | Mg | Pb | Fe | Cd | Cu | Sn | Zn | |
1 | 3.9 | 0.05 | 0.0026 | 0.003 | 0.0006 | <0.0005 | <0.0005 | Remaining |
2 | 3.9 | 0.05 | 0.0026 | 0.003 | <0.0003 | <0.0005 | <0.0005 | Remaining |
3 | 3.9 | 0.05 | 0.0025 | 0.003 | 0.0005 | <0.0005 | <0.0005 | Remaining |
Summary:
Due to the physical segregation of zinc alloy ingots, segregation can lead to deviations in the test results obtained by different sampling methods. From the above experimental results, the international standard sampling method can avoid the influence of segregation, and the most accurate and stable test results can be obtained. The other methods have their drawbacks, with methods 2 and 3 having the greatest deviations, while method 4 has the closest results to the standard method and can be used for daily monitoring, but sampling according to the standard method is required for final determination.